AI-Powered Data Analytics Course in Telugu: Learn In-Demand Skills and Become Job-Ready
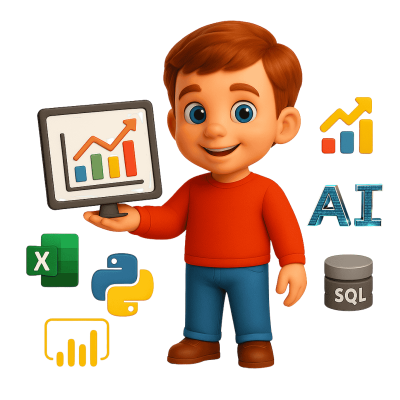
Launch your successful career with our AI Data Analytics Course in Telugu. Go from beginner to expert, mastering high-demand tools like Power BI, Tableau, Python, SQL, and Excel for real-time analysis and smart decision-making.
Data Analytics is the process of collecting, cleaning, analyzing and visualizing data to uncover meaningful insights and support better business decisions. Students learn essential analytics tools through structured modules, hands-on exercises and real-world projects covering Excel, SQL, Power BI and Python.
Excel & Data Analysis
Learn Excel fundamentals and advanced analytics techniques including formulas, functions, Pivot Tables, charts, data cleaning, lookup functions and dashboard creation for business reporting.
SQL & Databases
Understand how to store, retrieve and analyze data using SQL. Learn queries, joins, subqueries, aggregate functions, CTEs and practical database analysis using real-world datasets.
Power BI & Visualization
Learn to transform raw data into interactive dashboards and reports using Power BI. Work with Power Query, data modelling, DAX, KPIs, charts and business intelligence dashboards.
Python for Data Analytics
Use Python to analyze and process datasets with tools like Pandas, NumPy and Matplotlib. Learn data cleaning, exploratory data analysis, automation and insight generation through practical projects.
Data Analytics is one of the fastest-growing career domains on the planet. Here is why this is your golden ticket:
Massive Industry Demand
Companies across all industries are aggressively hiring Data Analysts to optimize operations and support CEO decision-making.
Easy Learning Path
Start with the fundamentals and gradually build practical skills using Excel, SQL, Power BI, Python, and AI-powered analytics tools.
High Salary Opportunities
Because your insights directly increase a company's revenue, roles like BI Developer and Analytics Consultant command premium paychecks.
Global Remote Opportunities
Data lives in the cloud. Analysts can work remotely, take on lucrative freelance contracts, and work with global clients from anywhere in the world.
Tools & Technologies You Will Learn
We take you from absolute beginner to building production-ready dashboards using the exact software dominating the tech industry.
Advanced Excel
The undeniable foundation of all data. Learn complex formulas, pivot tables, and dashboard basics.
SQL (Structured Query Language)
The most important skill for analytics professionals. Learn to write powerful queries to retrieve, filter, and execute complex JOIN operations from massive corporate databases.
Power BI
Master the undisputed king of business intelligence. Learn data modeling, DAX formulas, and how to build interactive, dynamic dashboards that wow executives.
Tableau
Master the art of visual storytelling. Learn how to design intuitive dashboards that allow businesses to explore data visually and spot trends instantly.
Python for Analytics
Don't let Python scare you. We teach you exactly how to use libraries like Pandas and NumPy for data cleaning and automation, making you vastly more valuable than a basic Excel user.
AI-Assisted Analytics
Learn to integrate ChatGPT, Power BI AI features, and predictive analytics systems directly into your workflow to write formulas and automate your reporting.
Analyze ride-sharing data to identify usage patterns, popular routes, revenue trends, and customer segments. Generate actionable insights to optimize pricing, driver allocation, and customer retention.
Tools Used:
Excel, SQL, Python, Pandas, NumPy, Matplotlib, Seaborn, Scikit-learn, Power BI
01
Airbnb Data Analysis
Analyze Airbnb listings to understand host behavior, guest preferences, pricing trends, amenities, reviews, and seasonal booking patterns. Build dashboards to support data-driven decisions.
Tools Used:
Excel, SQL, Python, Pandas, NumPy, Matplotlib, Seaborn, Power BI
02
Telecom Customer Churn Analysis
Analyze customer data to identify churn indicators, segment at-risk customers, and build machine learning models to predict churn. Develop strategies to improve customer retention and loyalty.
Analyze hospital and healthcare data to uncover patient trends, disease patterns, department performance, treatment costs, and operational insights. Develop KPI-driven dashboards for better decision-making.
Tools Used:
Excel • SQL • Power BI / Tableau • Python • ChatGPT / Copilot.
04
IPL Data Analysis
Analyze IPL match, player, and team performance data to identify winning trends, player contributions, and factors influencing match outcomes. Present insights through visualizations and dashboards.
Tools Used:
Python , Pandas ,Excel ,Power BI
01
Brazilian E-Commerce Analysis
Analyze e-commerce data to uncover purchase trends, customer demographics, order patterns, product reviews, payment methods, seller performance, and overall sales insights.
Tools Used:
Python , SQL , Excel , Power BI
02
Application Creation and Update Sets
Build a custom ServiceNow application, configure forms and layouts, and migrate changes across instances using Update Sets.
🛠 Tools Used: ServiceNow Studio • Forms • Update Sets • Tables
Onboarding Service Catalog
Create an employee onboarding catalog with service requests for laptops, mice, and other organizational resources
🛠 Tools Used: Incident Management • Forms • UI Policies • Business Rules
Incident Management
Configure the Incident Management lifecycle with forms, field conditions, and workflow customization
🛠 Tools Used: Incident Management • Forms • UI Policies • Business Rules
Change Management
Implement the Change Management lifecycle with customized forms and approval workflows.
I joined FLM's Data Analytics course, and it exceeded my expectations. Every penny was worth it with excellent training, guidance, and support. Highly recommended!
kambala ajay sankarData Analytics Student
Flm is Good platform from Learning new Skills recently I learned Data analytics Course It was a great learning experience They teach very well and mentor support in any time
It is a great platform for learning skills
Abbireddy HanookData Analytics Student
I'm glad I chose FLM for Data Analytics. The trainers were supportive, cleared every doubt, and provided real-time projects with excellent guidance.
Sai lakshmanData Analytics Student
I taken course for front line media in data analytics I learned lot of things for flm good mentorship and support guidance.
RamData Analytics Student
The Data Analytics course at FLM was excellent. Clear teaching, helpful study materials, doubt sessions, and real-time guidance made learning easy. Highly recommended
Ranga NikhithaData Analytics Student
I joined FLM for the Data Analytics course and had a great experience. Practical training in Excel, SQL, Power BI, and Python boosted my confidence. Highly recommended
Hema Navitha VeeravalliData Analytics Student
Thank you FLM.
The way you explain things makes even the most difficult topics easy to understand
saikumarData Analytics Student
I had a great learning experience at FLM. The trainers explained concepts clearly with real-time examples, and the hands-on projects built my confidence. Highly recommended
A.MOHITH KUMARData Analytics Student
I'm highly impressed with FLM's quality training and dedication to student success. Their structured learning approach makes it a great choice for career growth. Highly recommended
Ramshetty SrikanthData Analytics Student
I'm highly impressed with FLM's quality training and dedication to student success. Their structured learning approach makes it a great choice for career growth. Highly recommended!
Maddur MeghanaData Analytics Student
I joined FLM's AI-Powered Data Analyst course and loved it. Clear teaching, real-time examples, supportive trainers, and practical learning. Highly recommended!
Sushma PatelData Analytics Student
I enrolled in FLM's Data Analytics course and had a great experience. The practical training, hands-on projects, and supportive trainers helped me build strong skills and confidence.
HAFEEZA SHAIKData Analytics Student
My journey with FLM was amazing. The AI-Powered Data Analytics course enhanced my technical skills through practical learning, hands-on projects, and expert guidance. Highly recommended
Maddula Kusuma HarishData Analytics Student
I'm happy I joined FLM for the Data Analytics course. Affordable fees, clear teaching, quick support, and 2-year access to recorded videos made it a great learning experience. Highly recommended!
Sainivas VilasagaramData Analytics Student
I recently completed the Data Analytics course at FLM. As a non-IT learner, I had a great experience. The trainer was supportive, and the communication and resume-building sessions were very helpful. Highly recommended!
Manasa Reddy DumpalaData Analytics Student
I recently completed FLM's Data Analytics course. Clear teaching, real-time examples, hands-on practice, and career guidance made learning easy. Highly recommended
Pushpa lathaData Analytics Student
I started my Data Analytics journey with FLM as a fresher. Recorded sessions, clear teaching, and flexible learning helped me study at my own pace. Highly recommended
Venkat Kumar PerumallaData Analytics Student
The trainers at FLM explain every topic clearly with practical, industry-focused training. The support team is always helpful. Highly recommended
Digavinti ReddammaData Analytics Student
I joined FLM's Data Analytics course through Instagram. The training was worth every penny, with clear explanations and excellent guidance. Highly recommended
Our Students Share Their Data Analytics Learning Experience
Career Paths After Learning AI Data Analytics
Job Role
Experience
Average Salary
Fresher Salaries
Data Analyst
Fresher
₹4.5 – ₹6 LPA
Junior BI Analyst
Fresher
₹3 – ₹6 LPA
Business Analyst
Fresher
₹3.5 – ₹7 LPA
Data Associate
Fresher
₹2.5 – ₹4 LPA
AI Analytics Associate
Fresher
₹5 – ₹8 LPA
Job Role
Experience
Average Salary
Experienced Salaries
BI Consultant
3–5 Years
₹9 – ₹15 LPA
Python Data Analyst
3–5 Years
₹10 – ₹18 LPA
AI-Powered Analytics
4–6 Years
₹12 – ₹20 LPA
Data Visualization Specialist
5–8 Years
₹12 – ₹25 LPA
Top Companies Hiring Data Analytics Graduates
Career Advancement Results
At Frontlines Edutech, we believe in transforming careers through high-quality, industry-relevant education. Our focus is on providing practical skills and knowledge that lead to real-world success. With a proven track record of impactful learning, we ensure our students are well-equipped to excel in their chosen fields and achieve their career goals with confidence.
Happy Students
0k+
Batches Conducted
0+
Years Of Experience
0+
Satisfaction
0%
Frequently Asked Questions (FAQs)
1. Do I need a background in coding or heavy mathematics to learn Data Analytics?
No! Data Analytics is primarily a “Low-Code” field. While tools like Python and SQL are used, they are used for scripting and querying, not heavy software development. We focus on business logic, visualization, and using tools like Power BI. If you have basic logical thinking, we will teach you the rest from absolute zero..
2. I am from a B.Com/BBA/B.Sc background. Is this course right for me?
Yes! In fact, students with commerce and business backgrounds often make the best Data Analysts because they already understand business operations, sales, and finance. You are simply learning the digital tools to analyze that data.
3. Is learning just Excel enough to get a high-paying job?
Basic Excel gets you a basic data entry job. To command a top-tier Data Analyst salary, you must know how to handle massive datasets using SQL, and how to build interactive, automated dashboards using enterprise tools like Power BI and Tableau.
4. Will AI tools like ChatGPT replace Data Analysts?
No! AI will replace analysts who refuse to use AI. We teach you AI-Powered Analytics. You will learn how to use AI Copilots to write complex formulas for you, automate your reporting, and generate insights 10x faster than a traditional analyst.
5. What is the starting salary for a Data Analyst in India?
Because Data Analysts directly impact a company’s revenue and efficiency, they are paid a premium. Freshers can expect starting salaries between ₹4 LPA and ₹7 LPA. As you master Power BI and business intelligence, salaries rapidly scale to ₹15 LPA to ₹25 LPA+.
6. What is SQL used for in Data Analytics?
SQL (Structured Query Language) is used to retrieve, filter, and analyze massive amounts of business data stored in corporate databases. It is a mandatory skill for interacting with backend data systems.
7. Is Python important for Data Analytics?
Yes. Python is an incredibly powerful language used to automate repetitive workflows, clean messy datasets, and perform advanced predictive analytics that go beyond the capabilities of standard Excel.
8. Will I actually build real dashboards, or is this just theory?
This course is entirely practical and project-driven. You will build a professional portfolio containing real-time business dashboards—including E-commerce tracking, Airbnb pricing, and Customer Churn analysis—using real-world datasets.
9. Can Data Analysts work remotely or as freelancers?
Absolutely. Every business globally generates data, but most don’t know how to visualize it. You can easily take on highly lucrative freelance projects building Power BI dashboards or running marketing analytics for international clients right from your laptop.
10. Are the live training classes conducted in Telugu?
Yes! All sessions, practical tool implementations, and doubt-clearing classes are taught in Telugu. We break down complex SQL queries, database structures, and Python automation in your regional language to ensure absolute conceptual clarity.
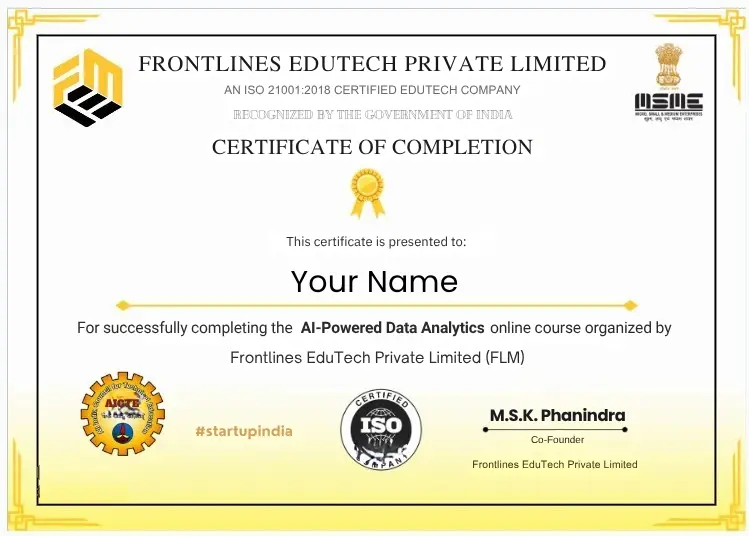
Get Certified
Yes, you’ll get a Certificate representing your Industry Readiness once you submit your projects and clear the pre placement test.